
Monday, November 9, 2015
Friday, November 6, 2015
Blogs on Indian Stock Market
There are several blogs on Indian stock market. I have been following several blogs on investing/trading.
1. Bramesh's Technical Analysis is an award-wining blog from Bramesh. The blog presents analysis on Nifty, Bank Nifty and 3 stocks daily. The posts talk about FII activities, open interest and options. It is helpful to understand the broader trend of the markets, important support and resistance levels. Bramesh also writes about important events which have an impact on Indian share market.

2. Just Nifty (Protected Blog) is a membership based blog with the message of getting rich slowly by Van Illango. He provides technical analysis on Nifty, Bank Nifty and posts table of Nifty 50 stocks with JNSar. Illango has developed his own system which buy/sell signal based on slow-macd. The blog provides 3 updates on Nifty during a trading session.

3. Nifty charts and latest updates is another blog on Indian stocks. The blogger also provides technical analysis on US stocks, nifty & stocks and commodity & forex.

4. Nifty Trader is simple and easy to understand blog. It provides information on Nifty open interest, option chain, put call ratio and other. There are sections on stocks, option strategy, bank nifty open interest and SGX Nifty. I like the tool category.

5. Marketcalls is another informative blog. The posts present advanced technical analysis, trading software reviews and trading strategies. It was started in September 2007 by Rajendran R. He is a System Trader and Trading strategy designer with a bachelor degree in Electronics and Communication engineering.

6. Chart Technicals was started in 2012 as a trading journal for intraday trading on Nifty. The blogger has developed a system called Decision Point trading for trading Nifty future and provides a free e-book on it. It is a great resource to learn day trading.

I am a consistent follower of all these blogs and learned a lot on technical analysis.
1. Bramesh's Technical Analysis is an award-wining blog from Bramesh. The blog presents analysis on Nifty, Bank Nifty and 3 stocks daily. The posts talk about FII activities, open interest and options. It is helpful to understand the broader trend of the markets, important support and resistance levels. Bramesh also writes about important events which have an impact on Indian share market.
2. Just Nifty (Protected Blog) is a membership based blog with the message of getting rich slowly by Van Illango. He provides technical analysis on Nifty, Bank Nifty and posts table of Nifty 50 stocks with JNSar. Illango has developed his own system which buy/sell signal based on slow-macd. The blog provides 3 updates on Nifty during a trading session.
3. Nifty charts and latest updates is another blog on Indian stocks. The blogger also provides technical analysis on US stocks, nifty & stocks and commodity & forex.
4. Nifty Trader is simple and easy to understand blog. It provides information on Nifty open interest, option chain, put call ratio and other. There are sections on stocks, option strategy, bank nifty open interest and SGX Nifty. I like the tool category.
5. Marketcalls is another informative blog. The posts present advanced technical analysis, trading software reviews and trading strategies. It was started in September 2007 by Rajendran R. He is a System Trader and Trading strategy designer with a bachelor degree in Electronics and Communication engineering.
6. Chart Technicals was started in 2012 as a trading journal for intraday trading on Nifty. The blogger has developed a system called Decision Point trading for trading Nifty future and provides a free e-book on it. It is a great resource to learn day trading.
I am a consistent follower of all these blogs and learned a lot on technical analysis.
Thursday, October 29, 2015
Adani ports & special economic zone - Update [1]
Please refer earlier post on Adani Ports here.

Observations:
Monthly/Weekly Trend: Range bound
Broader Range: 295 ~ 370
Weekly Supply Zone: 282.85 ~ 266.45
Adani Ports has been range bound since Jan. 2015. The broader range is 295 to 370. The weekly supply zone is in the range of 282.85 ~ 266.45. However, the price had not come in this range in several months.
It is imporant to watch today's closure which completes weekly and monthly timeframe.
FY16 Q2 result: 2nd November.
Disclosure: I am holding shares of Adani Ports. The chart above is created using http://in.investing.com/.
Disclaimer: The views presented on desiBULLZ are my personal views. The analysis is my study of technical analysis and for educational purpose only. The views and analysis are not trading tips and should not be used for trading. The financial gain/loss arising by using the views/analysis is the personal responsibility of stock trader/investor.
NMDC - Update [2]
Please refer earlier update on NMDC here.


On 16th Oct., NMDC closed above the monthly trend line tested 105.50 as shown in the daily chart. After a brief downward movement, it has resumed the upward movement towards resistance of 105.5 level. In past two sessions, NMDC has shown resilience despite the broader market was negative. Monthly and weekly closes have to be watched today.
Following is the levels and trends are still valid.
Monthly trend [T1]: DOWN
Weekly/Daily trend [T2]: UP (not shown in charts)
Weekly supply zone [R1]: 102.2 ~ 105.1
Daily supply zone [R2]: 102.90 ~ 105.1 - inside R1
Disclosure: I am holding shares of NMDC. The chart above is created using http://in.investing.com/.
Disclaimer: The views presented on desiBULLZ are my personal views. The analysis is my study of technical analysis and for educational purpose only. The views and analysis are not trading tips and should not be used for trading. The financial gain/loss arising by using the views/analysis is the personal responsibility of stock trader/investor.
Monday, October 19, 2015
Bharat Forge
Bharat Forge Limited is the flagship company of the USD 2.4 billion Kalyani Group founded by Nilkanthrao Kalyani in 1961 and commenced its operations in 1966. It is a Pune-based Indian multinational company involved in automotive, power, oil and gas, construction & mining, locomotive, marine and aerospace industries. The company has manufacturing operations across nine locations and six countries – 2 in India, 3 in Germany and one each in Sweden, Scotland UK, USA & China.

Bharat Forge Limited (BFL) has the presence in following industrial sectors and products.

Company financial for past 5 years

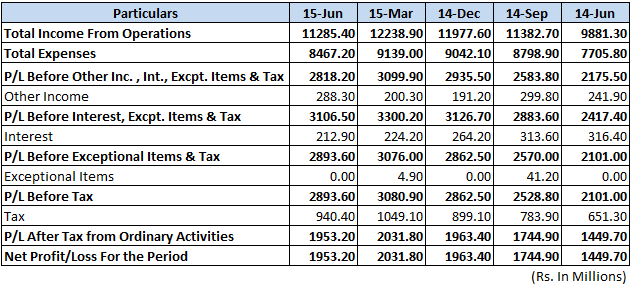
Quarterly results [Standalone]
10-year trend


[Source: Bharat Forge website]
Bank of America Merill Lynch has downgraded Bharat Forge to underperform. Price target has been cut by 10% to Rs 1130. A decline in heavy truck orders in North America was the reason behind the downgrade. This will slow down the exports of steel forgings to the US truck and machinery sector.
CLSA has also downgraded Bharat Forge to sell sighting the reason of export slowdown. It has set a target price of Rs 745.
Is this a good opportunity for an investment? More to follow...
NMDC - Update [1]
Please refer my earlier posts on NMDC technical here.


NMDC closed above the monthly trend line and is in the weekly and daily supply zones R1 & R2. Following is the levels and trends.
Monthly trend [T1]: DOWN
Weekly/Daily trend [T2]: UP (changed from the previous post)
Weekly supply zone [R1]: 102.2 ~ 105.1
Daily supply zone [R2]: 102.90 ~ 105.1 - inside R1
There is double bottom pattern formation is in progress. However, the pattern is not complete yet. It completes once the price moves past the highest price of the peak which is around 105.1. The double bottom is bullish reversal pattern and 140 is the target. But there are resistances/supply zone in between.
If the supply zones R1 & R2 are taken out decisively, it opens a possibility of targets 112 & then 123. On the reverse, it may test the weekly/daily trend line T2. Conservative traders can book the profit and wait for next entry opportunity.
Disclosure: I am holding shares of NMDC. The chart above is created using tradingview.
Disclaimer: The views presented on desiBULLZ are my personal views. The analysis is my study of technical analysis and for educational purpose only. The views and analysis are not trading tips and should not be used for trading. The financial gain/loss arising by using the views/analysis is the personal responsibility of stock trader/investor.
Wednesday, October 14, 2015
Tata Power [BOM500400] - Update
Please refer to my earlier update here.

From past five trading sessions, tata power is struggling in the upper area of R1 [Weekly supply zone [R1]: 67.2 ~ 70.05. Click here for the details]. It has breached the T1 trend line, but the T2 trend line is still intact. The coming two trading session is crucial and would decide the next course.
Possibilities:
1. Close below the T1 trend line and continue the down trend
2. Test the T2 trend line and decisively break the T2 and the upper boundary of R1. But close above 70.05/70.15 on daily/weekly basis is required.
Let's see how it pans out.
Disclosure: I am holding shares of tata power. The chart above is created using tradingview.
Disclaimer: The views presented on desiBULLZ are my personal views. The analysis is my study of technical analysis and for educational purpose only. The views and analysis are not trading tips and should not be used for trading. The financial gain/loss arising by using the views/analysis is personal responsibility of stock trader/investor.
Subscribe to:
Posts (Atom)