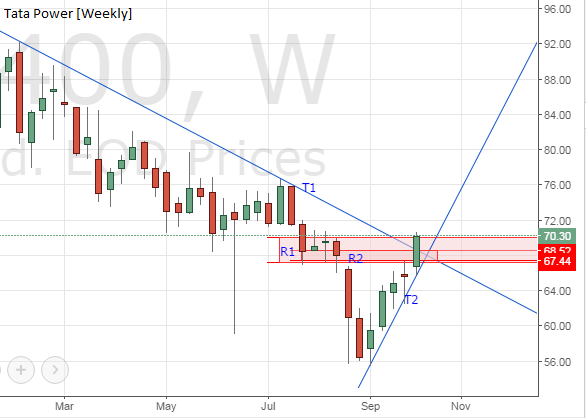
On 6th, Tata power closed above 68 and breached the daily supply zone R2. And on 7th, it closed above 70 breaching the weekly supply zone R1. The close has also violated the trendline T1. However, there are two more trading sessions for weekly close. The closes in past two/three weeks has respected the trend line T2.
On monthly chart, following are two supply zones.
Supply zone [R3]: 86.8 ~ 92.4
Supply zone [R4]: 104.7 ~ 115.15
Monthly trend: DOWN
The daily close on 7th is right of the monthly trend line (green line on monthly chart). The next two trading sessions are important for,
1. closing above the R1 and R2, and
2. testing the monthly trend line.
Closing above the monthly trend line with open up the possibility of testing the R3 zone.
Disclosure: I am holding tata power shares.
Disclaimer: The views presented on desibullz are my personal views. The analysis is my study of technical analysis and for educational purpose only. The views and analysis are not trading tips and should not be used for trading. The financial gain/loss arising by using the views/analysis is personal responsibility of stock trader/investor.


simple and nice analysis.. :)
ReplyDeleteThanks for support...
DeleteVery nice keep doing your wonderful analysis
ReplyDeleteThank you Bramesh. I have learned a lot from your analysis. Please keep on posting great articles. Kindly provide your valuable comments/suggestions.
ReplyDelete